Body
Image

Visualizing Funds of Identity while Exploring Data Literacy Concepts
Integrating Students’ Interests, Identities and Ways of Knowing with Network Visualization Tools to Explore Data Literacy Concepts is a Developing and Testing Innovations project responding to the growing recognition that data literacy is an increasingly important set of skills and network science in particular is at the heart of today’s youth’s experiences with technology. The goal of this project is to explore a synergistic approach in which middle school students (7th and 8th grades) use network visualization to learn about themselves and their communities, while simultaneously learning about the underlying network science and data literacy principles that make their exploration possible, and which are central to their experiences with many common technologies. To accomplish this, the project team has partnered with middle school teachers to design, implement, and study lessons about network visualization using the open-source Net.Create software tool. As part of a co-design process with teachers, we are creating history and English language arts lessons that will help students engage with core network visualization and data literacy practices in service of an exploration of their own, and their communities’, interests and lives that also meets key digital literacy and disciplinary standards.
Pillar 1: Innovative Use of Technologies in Learning and Teaching
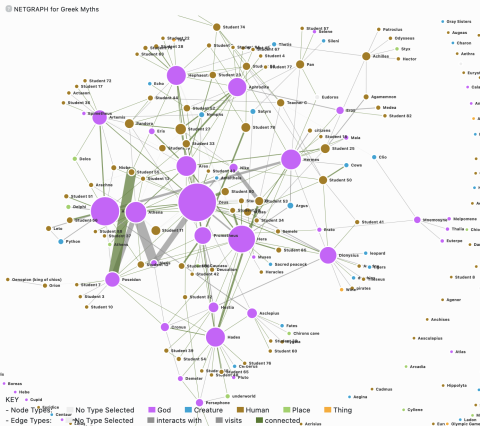
Our project utilizes the network visualization tool Net.Create (https://netcreate.org/) to provide opportunities for students to create data visualizations of subject-area content. These visualizations provide unique data representations through which students and teachers have the opportunity to engage with data literacy concepts and content knowledge while also exploring connections between themselves, the content, and their peers.
Pillar 2: Partnerships for Career and Workforce Preparation.
Through the novel opportunity to engage with Net.Create and data visualizations, our project introduces students to the ways in which network visualizations and networking are central to common technologies and integral to many career paths. Building on our partner district’s existing computational thinking and STEAM pathways, this work provides students with deeper exploration of skills needed for careers and workforce opportunities related to data literacy and network visualizations.
Pillar 3: Strategies for Equity in STEM Education
Our project explores how network visualizations can heighten student engagement in learning by integrating student interests, content knowledge, and data literacy. Through the integration of student interests and identities, the lessons and visualizations are more responsive to students and they are able to see themselves reflected within the data literacy and subject-area content. Further, teachers learn about students’ individual and collective identities and interests from what they share within the visualizations.
Discipline(s)
Data Science
Other
Target Gradespan(s)
Middle school (6-8)
Target Participant(s)
Youth / students
Project Setting(s)
Formal Education
Category
Developing and Testing Innovations (DTI)