We are excited to introduce the ITEST Project Dashboard, developed by EDC. Below is a brief video and written overview to help you navigate its features and explore the insights it offers. Visit the ITEST Project Dashboard
Getting Started
- Accessing the Dashboard: Visit the ITEST Project Dashboard landing page.
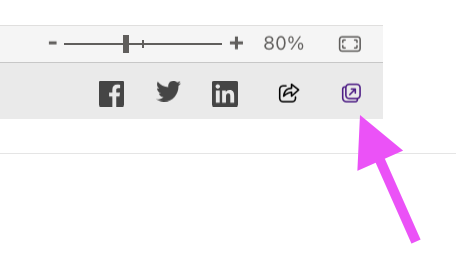
- Optimizing Your View: For the best experience, open the dashboard in full browser window by clicking the icon in the bottom-right corner of the page.

Dashboard Overview
The dashboard highlights key results from six years of annual survey data. These surveys cover a broad range of topics related to ITEST projects.
Using this dashboard, you can explore charts and visuals on:
- ITEST Project Landscape Overview
- Youth Participants
- STEM Disciplines & ICT Career Fields
- Partnerships
To navigate, use the four tabs at the top of the screen or the arrows at the bottom.
Tab 1: ITEST Overview
The ITEST Overview tab provides up-to-date data on:
- Total participants served
- Number of active awards
- A searchable project list
- A map showing project locations by state
The map uses two colors to distinguish between EPSCoR states (orange) and non-EPSCoR states (dark blue). Filtering Data: Use the filters in the top-left corner to customize the displayed data. For instance, filtering by Hawaii will show data specific to projects in that state. On this page, you can see participant numbers, project statuses, and map locations specific to the selected state. Click the “Project Details” button for abstracts and additional project information.
Tab 2: Youth Participants
The Youth Participants tab displays data on participant demographics, disaggregated by:
- Racial and ethnic groups
- Gender
- Other underserved populations
You can filter by survey year to view data from specific periods. Keep in mind that not all projects report data at this level, so results may vary.
Tab 3: STEM Disciplines & ICT Career Fields
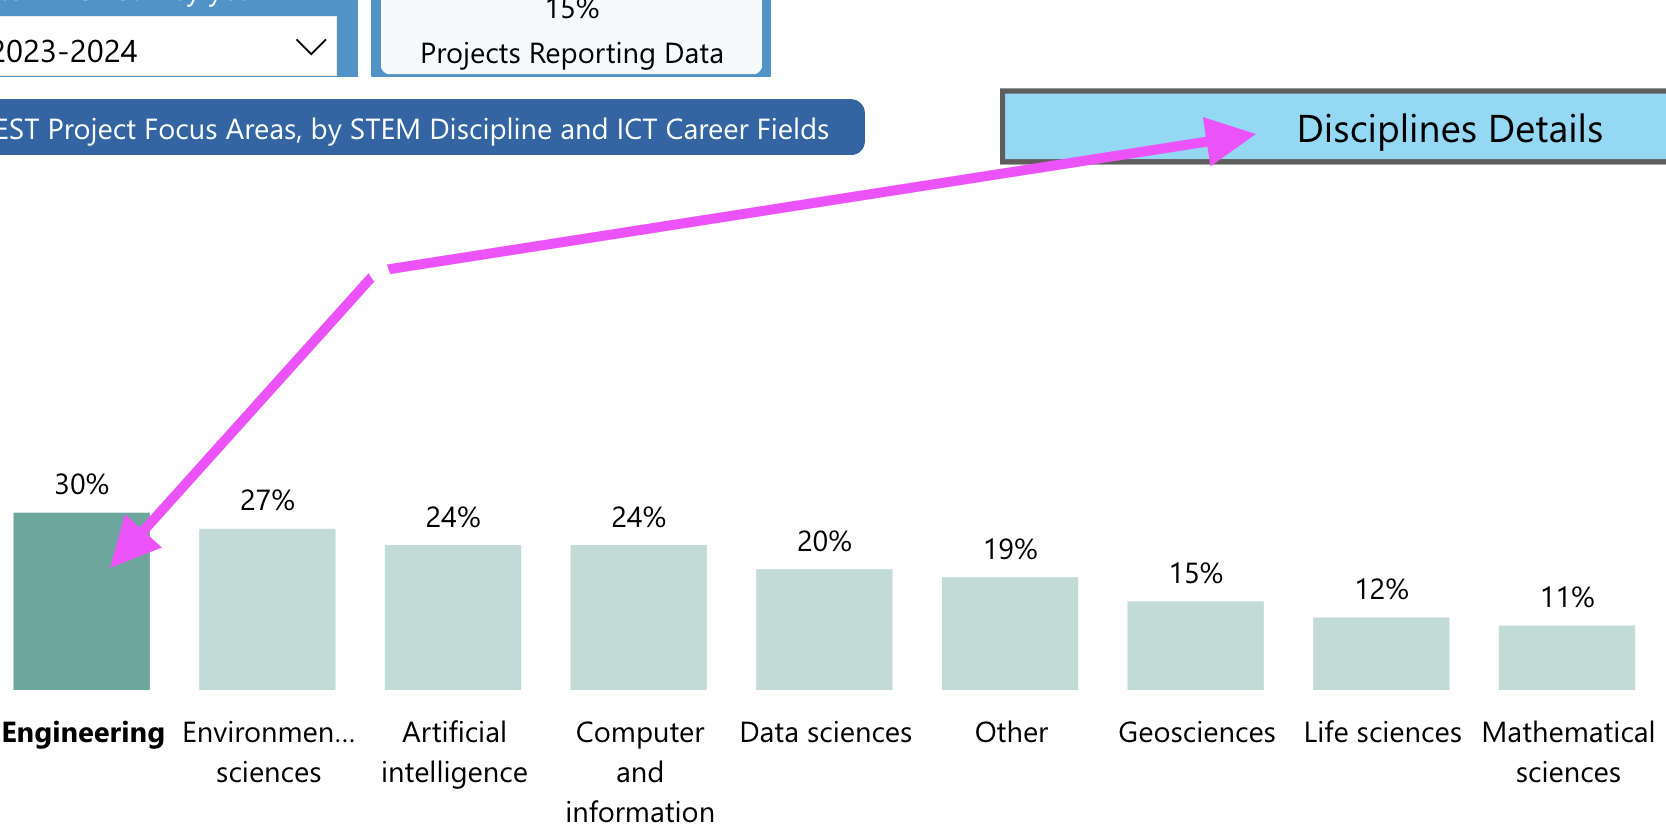
The STEM Disciplines & ICT Career Fields tab shows project distributions by discipline or career focus for a given reporting year.
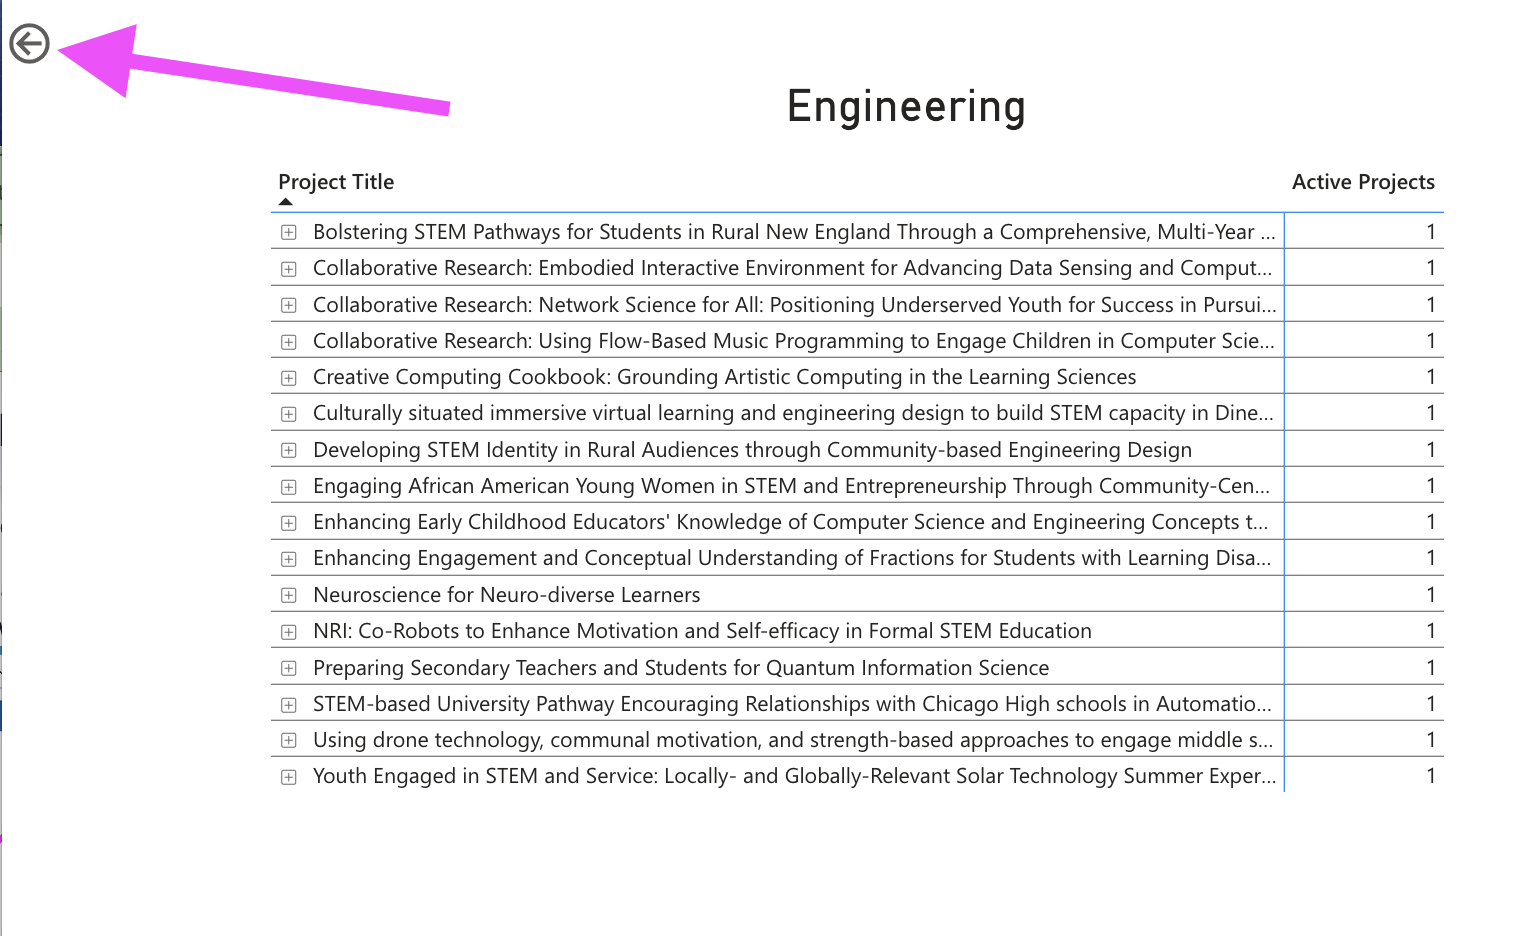
Interactive Feature: Click a bar on the graph to see a detailed list of projects within that discipline. For example, selecting “Engineering” will display a table of projects working in this area. 

Use the back arrow in the top-left corner to return and explore other disciplines, such as Artificial Intelligence.
Tab 4: Partnerships
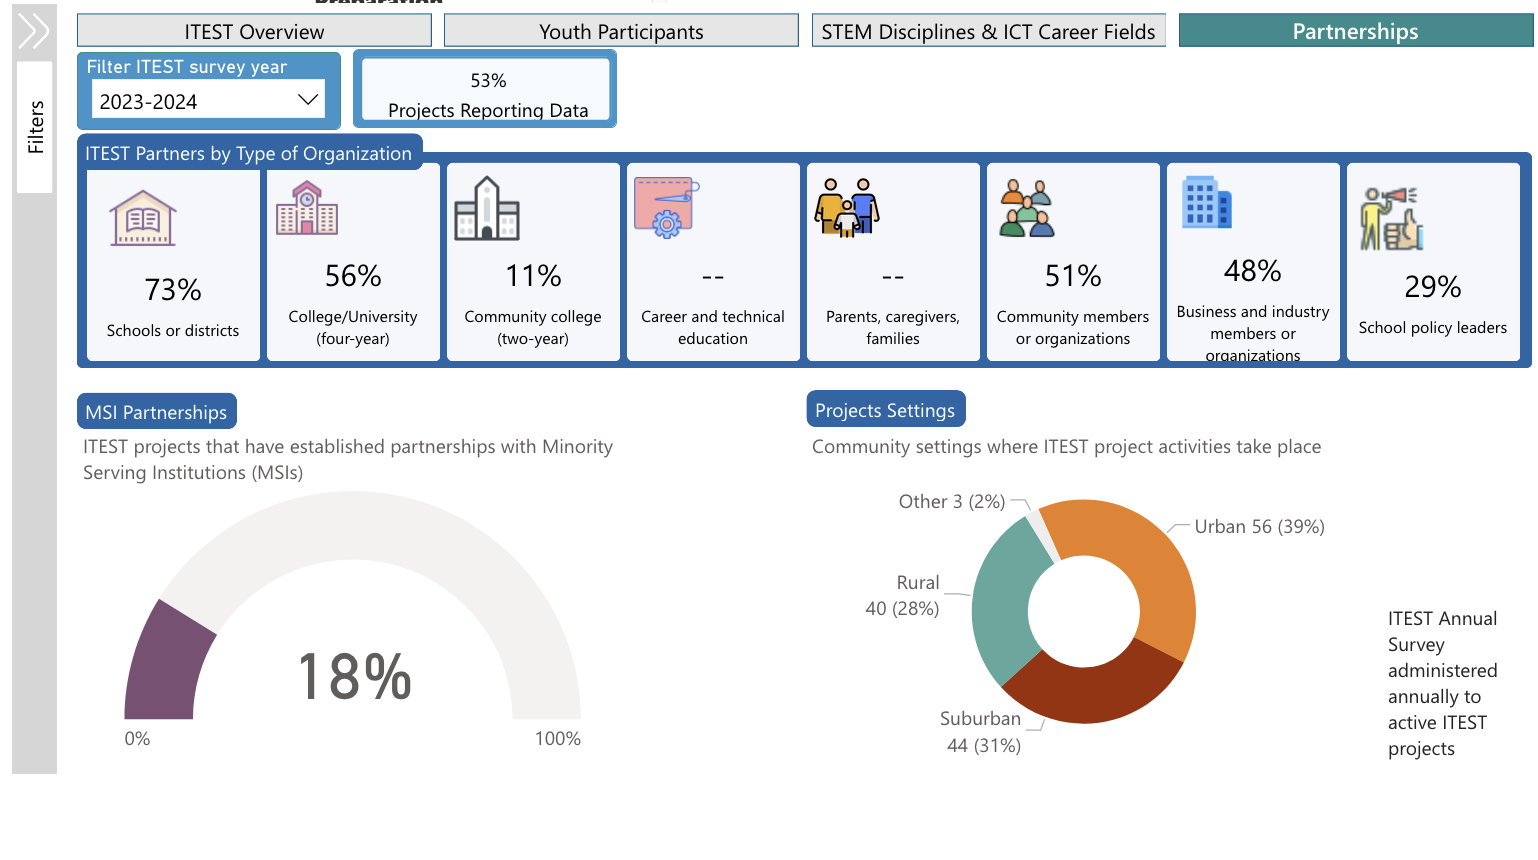
The Partnerships tab provides insights into:
- Partner organizations supporting ITEST projects
- Collaborations with Minority Serving Institutions
- Community settings for project activities
Like other tabs, data can be filtered by survey year for specific reporting periods. 
If you have questions or need assistance, please don’t hesitate to reach out.